San Francisco Real Estate Market Trends
Key Updates, Trends, and Insight for the San Francisco, CA Real Estate Market
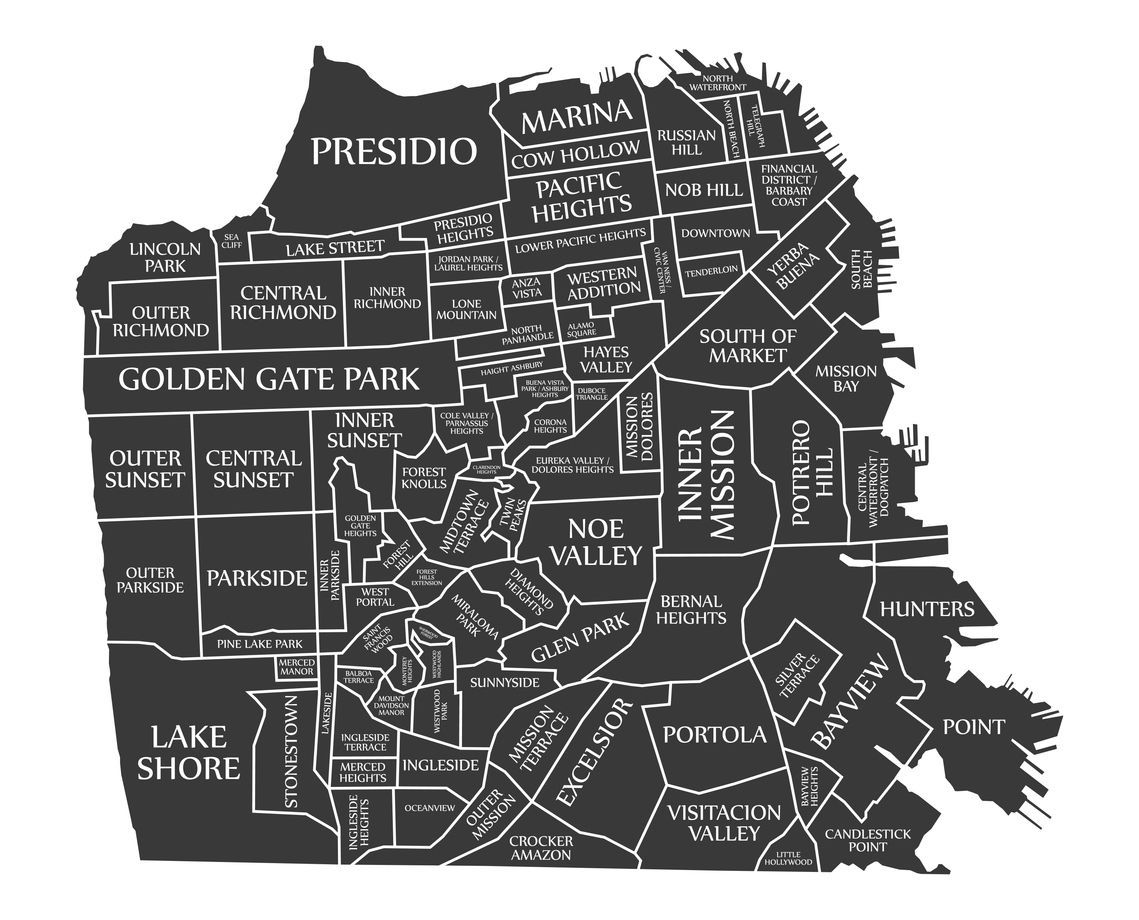
San Francisco Real Estate Market Trends - Single Family Homes & Condos
San Francisco

Q1 Analysis: Jan-March
2024:
Active Listings: 804
Avg. List Price: $1,660,334 (↑)
Avg. Sale Price: $1,708,648 (↑)
Closed Sales: 769 (↑)
Avg. Days on Market: 44 (↓)
2023:
Avg. List Price: $1,549,361 (↓)
Avg. Sale Price: $1,567,199 (↓)
Closed Sales: 753 (↓)
Avg. Days on Market: 51 (↑)
2022:
Avg. List Price: $1,637,175
Avg. Sale Price: $1,832,557
Closed Sales: 1,219
Avg. Days on Market: 30
Key Takeaway:
In Q1 2024, San Francisco's real estate market has experienced an increase in average list and sale prices, as well as in the number of closed sales, compared to Q1 2023. The average days on market have decreased, indicating a quicker turnover of properties. Compared to Q1 2022, there is a slight increase in the average list price, but a notable decrease in both average sale price and closed sales, suggesting a shift in market dynamics.
*Reported on 4/3/2024
Bayview

Q1 Analysis: Jan-March
2024:
Active Listings: 27
Avg. List Price: $842,139 (↓)
Avg. Sale Price: $853,676 (↓)
Closed Sales: 23 (↓)
Avg. Days on Market: 63 (↓)
2023:
Avg. List Price: $848,031 (↓)
Avg. Sale Price: $870,538 (↓)
Closed Sales: 26 (↓)
Avg. Days on Market: 78 (↑)
2022:
Avg. List Price: $942,891
Avg. Sale Price: $1,063,438
Closed Sales: 32
Avg. Days on Market: 21
Key Takeaway:
In Q1 2024, Bayview's real estate market has experienced a decrease in average list and sale prices, as well as in the number of closed sales, compared to Q1 2023. The average days on market have decreased, indicating a quicker turnover of properties. Compared to Q1 2022, there is a notable decrease in both average list and sale prices, as well as in closed sales, suggesting a shift in market dynamics.
*Reported on 4/3/2024
Bernal Heights/Mission

Q1 Analysis: Jan-March
2024:
Active Listings: 45
Avg. List Price: $1,438,016 (↓)
Avg. Sale Price: $1,478,750 (↓)
Closed Sales: 63 (↑)
Avg. Days on Market: 37 (↑)
2023:
Avg. List Price: $1,479,123 (↓)
Avg. Sale Price: $1,561,358 (↓)
Closed Sales: 57 (↓)
Avg. Days on Market: 31 (↑)
2022:
Avg. List Price: $1,535,294
Avg. Sale Price: $1,753,328
Closed Sales: 107
Avg. Days on Market: 23
Key Takeaway:
In Q1 2024, the Bernal Heights/Mission real estate market has experienced a decrease in average list and sale prices, but an increase in the number of closed sales compared to Q1 2023. The average days on market have increased, indicating a slower turnover of properties. Compared to Q1 2022, there is a notable decrease in both average list and sale prices, as well as in closed sales, suggesting a shift in market dynamics.
*Reported on 4/3/2024
Duboce Triangle

Q1 Analysis: Jan-March
2024:
Active Listings: 43
Avg. List Price: $1,931,261 (↓)
Avg. Sale Price: $2,020,739 (↑)
Closed Sales: 88 (↑)
Avg. Days on Market: 33 (↓)
2023:
Avg. List Price: $1,970,327 (↑)
Avg. Sale Price: $2,013,368 (↓)
Closed Sales: 78 (↓)
Avg. Days on Market: 39 (↑)
2022:
Avg. List Price: $1,928,446
Avg. Sale Price: $2,192,910
Closed Sales: 112
Avg. Days on Market: 19
Key Takeaway:
In Q1 2024, Duboce Triangle's real estate market has experienced a slight decrease in average list price but an increase in average sale price compared to Q1 2023. The number of closed sales has increased, and the average days on market have decreased, indicating a quicker turnover of properties. Compared to Q1 2022, there is a slight increase in the average list price, but a noticeable decrease in both average sale price and closed sales, suggesting a shift in market dynamics.
*Reported on 4/3/2024
Excelsior
Q1 Analysis: Jan-March
2024:
Active Listings: 39
Avg. List Price: $1,132,729 (↓)
Avg. Sale Price: $1,206,539 (↓)
Closed Sales: 41 (↓)
Avg. Days on Market: 47 (↑)
2023:
Avg. List Price: $1,179,024 (↑)
Avg. Sale Price: $1,220,788 (↓)
Closed Sales: 48 (↓)
Avg. Days on Market: 34 (↑)
2022:
Avg. List Price: $1,107,586
Avg. Sale Price: $1,308,906
Closed Sales: 71
Avg. Days on Market: 21
Key Takeaway:
In Q1 2024, Excelsior's real estate market has experienced a decrease in average list and sale prices, as well as in the number of closed sales, compared to Q1 2023. The average days on market have increased, indicating a slower turnover of properties. Compared to Q1 2022, there is an increase in the average list price, but a notable decrease in both average sale price and closed sales, suggesting a shift in market dynamics.
*Reported on 4/3/2024
Glen Park
Q1 Analysis: Jan-March
2024:
Active Listings: 36
Avg. List Price: $1,566,046 (↑)
Avg. Sale Price: $1,664,968 (↑)
Closed Sales: 41 (↓)
Avg. Days on Market: 33 (→)
2023:
Avg. List Price: $1,463,278 (↓)
Avg. Sale Price: $1,537,366 (↓)
Closed Sales: 46 (↓)
Avg. Days on Market: 33 (↑)
2022:
Avg. List Price: $1,724,990
Avg. Sale Price: $2,048,537
Closed Sales: 83
Avg. Days on Market: 22
Key Takeaway:
In Q1 2024, Glen Park's real estate market has experienced an increase in average list and sale prices compared to Q1 2023, but a decrease in the number of closed sales. The average days on market remain unchanged, indicating a stable turnover of properties. Compared to Q1 2022, there is a notable decrease in both average list and sale prices, as well as in closed sales, suggesting a shift in market dynamics.
*Reported on 4/3/2024
Marina

Q1 Analysis: Jan-March
2024:
Active Listings: 46
Avg. List Price: $3,567,400 (↑)
Avg. Sale Price: $3,478,000 (↑)
Closed Sales: 25 (↑)
Avg. Days on Market: 39 (↓)
2023:
Avg. List Price: $2,897,133 (↑)
Avg. Sale Price: $2,778,867 (↑)
Closed Sales: 15 (↓)
Avg. Days on Market: 50 (↑)
2022:
Avg. List Price: $2,581,175
Avg. Sale Price: $2,745,038
Closed Sales: 40
Avg. Days on Market: 23
Key Takeaway:
In Q1 2024, Marina's real estate market has experienced a significant increase in average list and sale prices compared to Q1 2023, along with an increase in the number of closed sales. The average days on market have decreased, indicating a quicker turnover of properties. Compared to Q1 2022, there is a considerable increase in both average list and sale prices, but a decrease in closed sales, suggesting a shift in market dynamics.
*Reported on 4/3/2024
Noe Valley

Q1 Analysis: Jan-March
2024:
Active Listings: 30
Avg. List Price: $2,008,172 (↓)
Avg. Sale Price: $2,096,563 (↓)
Closed Sales: 64 (↑)
Avg. Days on Market: 34 (↓)
2023:
Avg. List Price: $2,269,116 (↑)
Avg. Sale Price: $2,326,557 (↑)
Closed Sales: 43 (↓)
Avg. Days on Market: 41 (↑)
2022:
Avg. List Price: $1,754,741
Avg. Sale Price: $2,023,453
Closed Sales: 54
Avg. Days on Market: 19
Key Takeaway:
In Q1 2024, Noe Valley's real estate market has experienced a decrease in average list and sale prices, but an increase in the number of closed sales compared to Q1 2023. The average days on market have decreased, indicating a quicker turnover of properties. Compared to Q1 2022, there is an increase in the average list price, but a slight decrease in average sale price and an increase in closed sales, suggesting a shift in market dynamics.
*Reported on 4/3/2024
Potrero Hill

Q1 Analysis: Jan-March
2024:
Active Listings: 74
Avg. List Price: $1,246,853 (↓)
Avg. Sale Price: $1,252,140 (↓)
Closed Sales: 52 (↑)
Avg. Days on Market: 58 (↑)
2023:
Avg. List Price: $1,603,243 (↓)
Avg. Sale Price: $1,628,592 (↓)
Closed Sales: 36 (↓)
Avg. Days on Market: 35 (↑)
2022:
Avg. List Price: $2,090,172
Avg. Sale Price: $2,350,679
Closed Sales: 58
Avg. Days on Market: 19
Key Takeaway:
In Q1 2024, Potrero Hill's real estate market has experienced a significant decrease in average list and sale prices compared to Q1 2023, but an increase in the number of closed sales. The average days on market have increased, indicating a slower turnover of properties. Compared to Q1 2022, there is a drastic decrease in both average list and sale prices, and a slight decrease in closed sales, suggesting a shift in market dynamics.
*Reported on 4/3/2024
Richmond District

Q1 Analysis: Jan-March
2024:
Active Listings: 43
Avg. List Price: $2,610,212 (↓)
Avg. Sale Price: $2,684,647 (↓)
Closed Sales: 56 (↑)
Avg. Days on Market: 32 (↓)
2023:
Avg. List Price: $2,759,442 (↑)
Avg. Sale Price: $2,712,218 (↑)
Closed Sales: 54 (↓)
Avg. Days on Market: 39 (↑)
2022:
Avg. List Price: $1,932,066
Avg. Sale Price: $2,195,677
Closed Sales: 90
Avg. Days on Market: 22
Key Takeaway:
In Q1 2024, Richmond's real estate market has experienced a decrease in average list and sale prices compared to Q1 2023, but an increase in the number of closed sales. The average days on market have decreased, indicating a quicker turnover of properties. Compared to Q1 2022, there is a significant increase in both average list and sale prices, but a decrease in closed sales, suggesting a shift in market dynamics.
*Reported on 4/3/2024
Russian Hill

Q1 Analysis: Jan-March
2024:
Active Listings: 80
Avg. List Price: $1,237,875 (↑)
Avg. Sale Price: $1,217,596 (↓)
Closed Sales: 57 (↑)
Avg. Days on Market: 58 (↓)
2023:
Avg. List Price: $1,235,246 (↓)
Avg. Sale Price: $1,230,005 (↓)
Closed Sales: 56 (↓)
Avg. Days on Market: 66 (↑)
2022:
Avg. List Price: $1,536,308
Avg. Sale Price: $1,590,970
Closed Sales: 73
Avg. Days on Market: 42
Key Takeaway:
In Q1 2024, Russian Hill's real estate market has experienced a slight increase in average list price, but a decrease in average sale price, compared to Q1 2023. The number of closed sales has increased, while the average days on market have decreased, indicating a quicker turnover of properties. Compared to Q1 2022, there is a significant decrease in both average list and sale prices, as well as in closed sales, suggesting a shift in market dynamics.
*Reported on 4/3/2024
SoMa

Q1 Analysis: Jan-March
2024:
Active Listings: 101
Avg. List Price: $2,156,486 (↑)
Avg. Sale Price: $2,056,986 (↑)
Closed Sales: 37 (↑)
Avg. Days on Market: 74 (↓)
2023:
Avg. List Price: $1,865,037 (↑)
Avg. Sale Price: $1,717,523 (↑)
Closed Sales: 35 (↓)
Avg. Days on Market: 97 (↑)
2022:
Avg. List Price: $1,621,179
Avg. Sale Price: $1,595,988
Closed Sales: 56
Avg. Days on Market: 62
Key Takeaway:
In Q1 2024, Soma's real estate market has experienced an increase in average list and sale prices, as well as in the number of closed sales, compared to Q1 2023. The average days on market have decreased, indicating a quicker turnover of properties. Compared to Q1 2022, there is a significant increase in both average list and sale prices, but a decrease in closed sales, suggesting a shift in market dynamics.
*Reported on 4/3/2024
Sunset District

Q1 Analysis: Jan-March
2024:
Active Listings: 40
Avg. List Price: $1,360,766 (↓)
Avg. Sale Price: $1,525,504 (↑)
Closed Sales: 95 (↓)
Avg. Days on Market: 29 (↓)
2023:
Avg. List Price: $1,416,814 (↑)
Avg. Sale Price: $1,495,778 (↓)
Closed Sales: 110 (↓)
Avg. Days on Market: 32 (↑)
2022:
Avg. List Price: $1,395,000
Avg. Sale Price: $1,725,000
Closed Sales: 145
Avg. Days on Market: 24
Key Takeaway:
In Q1 2024, Sunset's real estate market has experienced a decrease in average list price but an increase in average sale price compared to Q1 2023. The number of closed sales has decreased, and the average days on market have also decreased, indicating a quicker turnover of properties. Compared to Q1 2022, there is a decrease in both average list and sale prices, as well as a significant drop in closed sales, suggesting a shift in market dynamics.
*Reported on 4/3/2024
